Building Housing in Walkable Neighborhoods: Are U.S. Cities and States Making Progress?
Published On May 22, 2025
Urban form shapes transportation behavior. Built environment characteristics such as housing density, street connectivity, and proximity to jobs and services help determine how many miles people have to drive every day. Once neighborhoods are constructed, these characteristics can persist for a long time, with many street networks lasting for hundreds of years.
Passenger travel in cars and trucks represents the single largest source of climate pollution from U.S. households, as well as creating a large and growing cost burden for individuals and families. Public health, local environments, and social equity also suffer from the harms of car-oriented development patterns. Thus, many policymakers are trying to enable housing growth in communities where people can accomplish their daily activities without so much driving. Often, this means integrating new housing into existing walkable or transit-oriented neighborhoods (“infill”), though it can also mean reducing reliance on cars when new communities are planned.
In some states, this policy focus spans decades. In 1973, Oregon introduced a state land use planning law to encourage infill housing and discourage suburban expansion; Washington enacted a similar law in 1990. This focus expanded with the emergence of policies to prevent climate change. California’s 2008 Sustainable Communities law called for regional plans to emphasize infill housing near transit, and recently, Massachusetts has required suburbs on commuter rail lines to zone for more housing.
But have we made progress? To investigate this question, we analyzed historical patterns of housing development, along with present-day transportation patterns. Progress nationally has been modest, but some metro areas have outperformed national trends—and understanding where these are and what they have done may help inform broader reforms.
How can we measure progress at the metro level, over time?
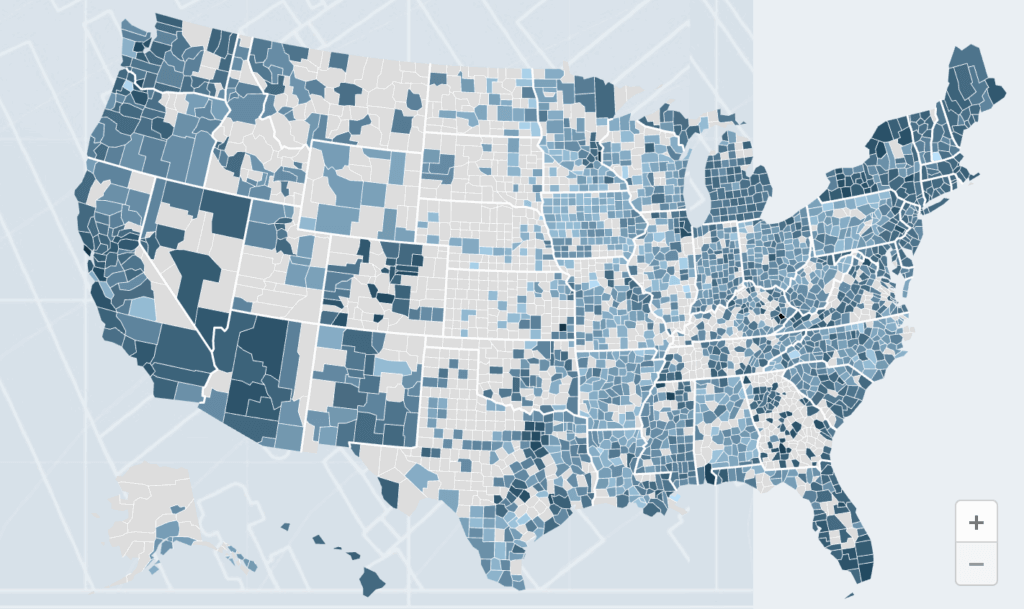
We analyzed neighborhoods throughout the contiguous United States,[1] focusing on average daily miles of car travel by residents of each neighborhood. Figure 1 allows users to generate charts for states or metropolitan regions in the United States.
Figure 1: How Cities and States are Making Progress[2]
Use the tool to select a state or metropolitan region to see historical patterns and compare them to national patterns.
Note: Unlabeled metropolitan regions are combined statistical areas, while those labeled “(Metro)” are metropolitan statistical areas.
We divided U.S. neighborhoods into five categories based on vehicle miles traveled (VMT) per resident in 2023 (Table 1). In lower-VMT neighborhoods (i.e., “Very Low VMT” and “Low VMT”), daily destinations such as schools and grocery stores may be within walking distance, and typical trip distances are modest even when people drive. In higher-VMT neighborhoods (i.e., “High VMT” and “Higher VMT”), many daily destinations require driving, often via high-traffic roads and freeways, and commute distances tend to be longer.
Table 1: Characteristics of Neighborhood Categories
| VMT Category | Typical VMT (miles per person, per day) |
Example Cities with Similar Average VMT* |
| Very Low VMT | 12.0 | Baltimore, MD; Portland, OR; Seattle, WA |
| Low VMT | 17.3 | Dallas, TX; Los Angeles, CA; Denver, CO |
| Mid VMT | 21.0 | Kansas City, MO; San Antonio, TX; San Diego, CA |
| High VMT | 25.5 | Chula Vista, CA; Jacksonville, FL; Raleigh, NC |
| Very High VMT | 37.5 | Gulf Shores, AL; Truckee, CA; Key Largo, FL |
*Note that these averages are solely within city boundaries, not whole metro areas, as discussed below. Also note that we selected incorporated cities with Very High VMT for illustration, but most places in this VMT category are rural. Source: Authors’ analysis of Replica data.
Across the United States, much of the housing found in lower-VMT neighborhoods was built before 1940 (Figure 2). Sprawling, car-oriented development patterns were more prevalent between 1971 and 2010, with most housing built in low-density neighborhoods, leading to continued higher VMT today. Between 2011 and 2019, however, the average VMT of new housing dropped, as development in higher-VMT neighborhoods declined by 59 percent relative to 2001–2010.
Even as new housing between 2011 and 2019 tended to be built in lower-VMT neighborhoods, the absolute number of these homes built declined after 2010,[3] exacerbating the housing shortage and affordability crisis. These findings underscore previous research identifying a dichotomy between mostly slow-growth urban cores and outwardly expanding suburbs in post-war patterns of US development.
Figure 2: New housing by neighborhood VMT quintile in the United States.
How have different metro areas built housing over time?
This national average obscures more varied dynamics at the metropolitan scale. Four metropolitan regions illustrate contrasting trends (Figure 3):[4] Denver-Aurora (CO), Charlotte-Concord (NC-SC), Seattle-Tacoma (WA), and New York City-Newark (NY-NJ-CT-PA).
- Mixed Growth: The Denver region has grown rapidly in recent decades, but with a disproportionate share of this new housing in higher-VMT neighborhoods.
- High-VMT Growth: The Charlotte region added more housing each decade than the previous one from 1951–2010, but with the vast majority in higher-VMT neighborhoods.
- Low-VMT Growth: The Seattle region has grown at a similar rate to Denver and Charlotte, while building most new housing in lower-VMT neighborhoods throughout the entire time period.
- Slow Growth: Nearly all of the New York City region’s housing is found in lower-VMT neighborhoods, but much of its housing was built before 1940, with very little new development in recent decades. (Many rural communities with higher VMT have also grown slowly, but we did not represent them in this illustration.)
Figure 3: Housing built by neighborhood VMT quintile in four metropolitan regions.
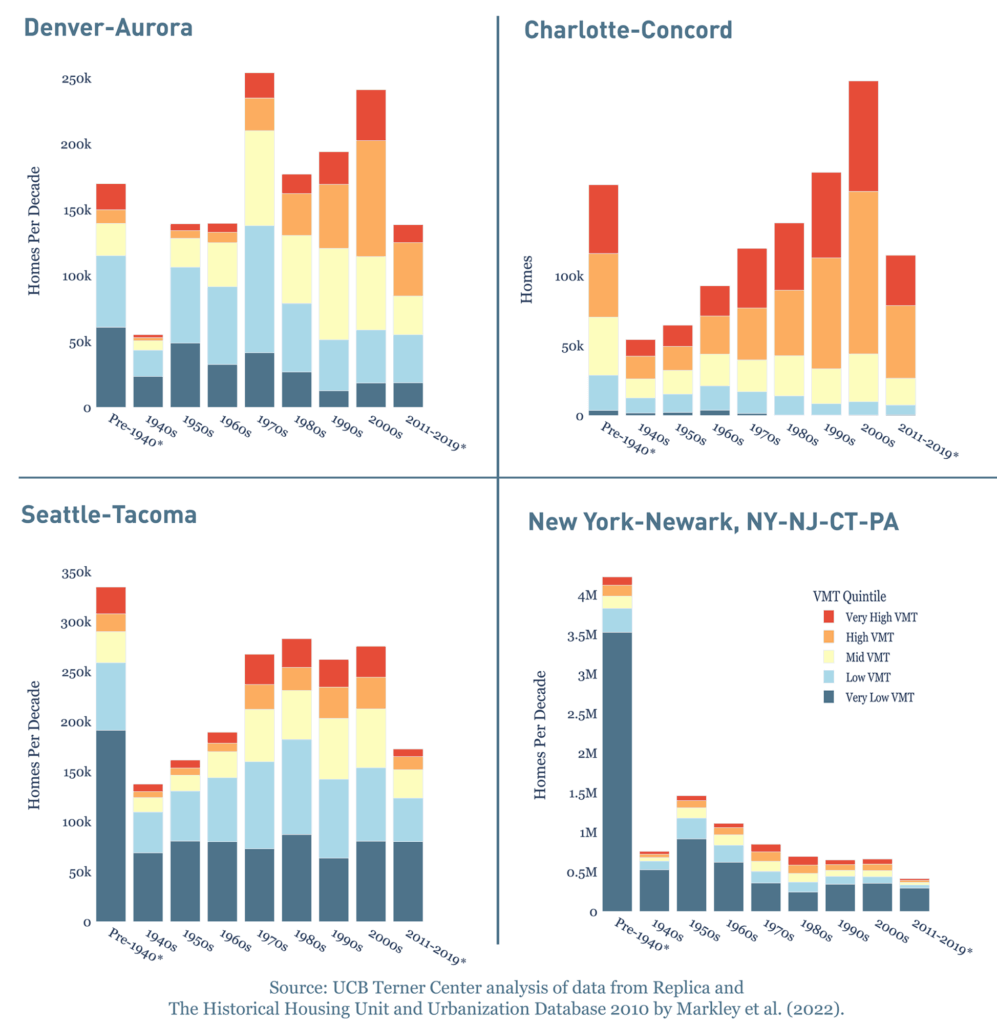
*Note different y-axis for each city.
What are the implications for policymakers?
Seattle is among five large metro regions that have built a large share of their homes since 2000 and predominately in lower-VMT neighborhoods, along with Portland, Salt Lake City, El Paso, and Miami (Table 2).[5]
While our analysis cannot attribute these trends to specific policies, both Seattle and Portland may be benefiting from their states’ longstanding land use planning frameworks, as well as more recent policies to encourage infill and transit-oriented housing development. Washington State as a whole reduced VMT per resident more than any other state between 1996 and 2021. Beginning with a 2019 law, Utah has encouraged cities to enable infill and denser housing, which could augment the trends placing Salt Lake City among these five (as our data end in 2019).
Research is still needed to understand the interaction of policy and market conditions in producing climate-friendly housing, and in what ways other cities may replicate the apparent success of these five metro regions. Already, researchers and advocates have identified many policy solutions to help cities build infill housing. Terner Center research has highlighted opportunities to: spur Accessory Dwelling Units and transit-oriented housing; streamline multifamily production; reduce development costs; and reward cities for pro-housing actions. Reforming parking mandates may both increase housing supply and decrease car use.
Additional policies to reduce reliance on cars both within existing neighborhoods, as well as when new neighborhoods are built, may complement infill housing. Historically, many environmental advocates have emphasized stopping new development of sprawling neighborhoods. This research suggests that development in higher-VMT neighborhoods is already slowing down, heightening the urgency of strategies to instead create more housing in lower-VMT neighborhoods.
Table 2: Five metropolitan regions that have recently succeeded in building housing in walkable neighborhoods.*
| 2001–2019 Share of Historical Housing Production | Share of 2001–2019 Housing Production in Lower-VMT Neighborhoods | Total Homes Built in 2001–2019 in Lower-VMT Neighborhoods | |
| Portland-Vancouver-Salem, OR-WA | 20% | 65% | 171,287 |
| Seattle-Tacoma, WA | 22% | 62% | 277,181 |
| Salt Lake City-Provo-Orem, UT | 29% | 59% | 153,594 |
| El Paso-Las Cruces, TX-NM | 25% | 49% | 52,697 |
| Miami-Fort Lauderdale-Port St. Lucie, FL | 19% | 44% | 252,095 |
*These are the only large metropolitan regions that built at least 15 percent of all housing since 2000, with at least 40 percent of units in lower-VMT neighborhoods. Source: Authors’ analysis of Replica and HHUUD10 data.
Acknowledgments
We would like to thank the Wells Fargo Foundation for supporting this research via the Terner Center’s Housing + Climate Policy initiative. We would like to thank Balaji Balaganesan for his help compiling data and drafting visualizations. We also thank Sarah Karlinsky, Ben Metcalf, Carolina Reid, and Rabi Abonour for providing comments on previous drafts.
This research does not represent the institutional views of UC Berkeley or of Terner Center’s funders. Funders do not determine research findings or recommendations in Terner Center’s research and policy reports.
Appendix: Methods
We followed the general approach of Freemark (2023) (specifically, Figure 2), substituting per capita VMT for tract housing density. We used U.S. census tracts as a proxy for neighborhoods. We merged decadal U.S. Census housing unit counts from Historical Housing Unit and Urbanization Database 2010 (HHUUD10)[6] with estimates of 2023 VMT per resident from Replica.[7] Based primarily on comprehensive censuses rather than surveys, the HHUUD10 historical reconstruction provides a level of precision suitable for this analysis; unfortunately, we are unaware of commensurate data to compare the 2020–2024 period with the 1940–2019 time period in HHUUD10. The Replica year-2023 VMT estimates were previously compared with federal data sources in Subin et al. (2024).
We defined decadal housing production for each census tract from 1940–2019 by subtracting the total housing units existing at the end of the previous decade. Pre-1940 was defined as the existing housing in 1940; and housing production during 2011–2019 was normalized to account for covering only nine years. We defined gross housing production by excluding shrinking tracts for each decade (i.e., gross housing production is assigned a zero value where decadal net housing production is less than zero). Note that this method does not exclude loss of housing at the sub-tract scale when it is balanced by new housing elsewhere in the tract.
We fixed VMT quintile thresholds using the population-weighted VMT per resident distribution for the entire contiguous United States: 15.3, 19.3, 23.1, and 29.2 miles per person, per day, yielding five equal-population quintiles. We identified representative cities within quintiles using the most populous and/or nationally recognizable census places whose population-weighted mean VMT was within 10 percent of each quintile’s neighborhood-median VMT. Note that the VMT distribution has an expected right skew: the U.S. population-weighted median and mean were 21.1 and 22.8 miles per person, per day, respectively. We developed stacked-bar charts by summing gross housing production by VMT quintile to larger geographies, either states or core-based statistical areas using 2010 Census boundaries from the Missouri Census Data Center. We developed line charts by calculating the geography-average VMT per resident for each decade, weighted by gross housing addition for each census tract.
We defined the top five metropolitan regions (Table 2) as those that: exceeded 400,000 cumulative homes produced (i.e., approximately exceeding one million in population); exceeded 15 percent housing produced since 2000; and exceeded 40 percent of this housing in lower-VMT neighborhoods (“Lowest VMT” and “Low VMT”). In doing so, we excluded metropolitan statistical areas when these were components of larger combined statistical areas.
Appendix: Application to State Transportation Scenario Planning
Several states, including California, Colorado, and Minnesota, have developed targets for statewide reduction of VMT per resident. Previous Terner Center research has evaluated the potential for infill housing to support these targets. The second panel of Figure 1 provides additional context for understanding the contribution of new housing to VMT reduction targets by allowing for a more informed baseline scenario using historical trends. Projected or actual future housing development can be evaluated against such a baseline scenario.
For example, the average (2023) neighborhood VMT of new housing in California declined from 23.7 to 21.3 miles per person, per day from the 2001–2010 period to the 2011–2019 period (Figure 1). This latter average happens to be close to the statewide average for today’s population of 21.1 miles per person, per day in these data (Table A1). Thus, assuming a baseline of continued housing development following 2011–2019 geographic patterns would be nearly equivalent to assuming a baseline of continued housing development matching the population average.
Table A1: State population-weighted statistics for vehicle miles traveled per person, per day in 2023.
| State | Mean | Median |
| AL | 29.1 | 27.7 |
| AR | 26.8 | 24.7 |
| AZ | 22.9 | 20.5 |
| CA | 21.1 | 20.0 |
| CO | 23.4 | 20.6 |
| CT | 20.4 | 19.5 |
| DC | 7.7 | 7.5 |
| DE | 22.1 | 20.9 |
| FL | 22.2 | 21.0 |
| GA | 27.1 | 25.6 |
| IA | 27.9 | 25.6 |
| ID | 23.5 | 18.9 |
| IL | 19.3 | 17.5 |
| IN | 22.4 | 21.0 |
| KS | 25.3 | 21.7 |
| KY | 26.8 | 24.9 |
| LA | 23.7 | 21.8 |
| MA | 18.8 | 18.4 |
| MD | 23.2 | 22.5 |
| ME | 29.8 | 28.7 |
| MI | 25.5 | 24.0 |
| MN | 25.6 | 22.7 |
| MO | 26.5 | 23.9 |
| MS | 31.8 | 31.2 |
| MT | 30.4 | 22.2 |
| NC | 28.9 | 27.6 |
| ND | 32.8 | 22.2 |
| NE | 25.0 | 20.6 |
| NH | 27.7 | 26.2 |
| NJ | 16.2 | 15.5 |
| NM | 27.5 | 21.2 |
| NV | 20.5 | 18.3 |
| NY | 13.5 | 11.6 |
| OH | 22.8 | 21.7 |
| OK | 27.0 | 24.0 |
| OR | 20.5 | 17.6 |
| PA | 19.9 | 18.4 |
| RI | 19.7 | 17.9 |
| SC | 27.2 | 25.8 |
| SD | 32.0 | 24.1 |
| TN | 26.9 | 25.2 |
| TX | 22.9 | 21.2 |
| UT | 20.1 | 18.0 |
| VA | 26.3 | 23.6 |
| VT | 32.6 | 30.7 |
| WA | 19.9 | 17.6 |
| WI | 25.6 | 23.5 |
| WV | 33.3 | 31.3 |
| WY | 31.6 | 23.9 |
| US | 22.8 | 21.1 |
Source: Authors’ analysis of Replica data.
References
Alameldin, M., & Underriner, Q. (2023, February 15). San Diego’s Success in Spurring Missing Middle Housing: The Accessory Dwelling Unit Bonus Program. Terner Center for Housing Innovation, University of California, Berkeley. https://ternercenter.berkeley.edu/research-and-policy/san-diego-adu-bonus-program/
Berube, A. (2024, September 6). How the pandemic changed—and didn’t change—where Americans are moving. Brookings Institution. https://www.brookings.edu/articles/how-the-pandemic-changed-and-didnt-change-where-americans-are-moving/
Blick, G., & Stewart, J. (2024). 2023 Census confirms Auckland gains more new homes (Insights Paper: Chief Economist Unit). Auckland Council. https://ourauckland.aucklandcouncil.govt.nz/news/2024/06/census-confirms-auckland-s-striking-shift-in-new-housing/
Chatman, D. G., Barbour, E., Kerzhner, T., Manville, M., & Reid, C. (2023). Policies to improve transportation sustainability, accessibility, and housing affordability in the state of California. Institute of Transportation Studies, University of California, Berkeley. https://escholarship.org/uc/item/03z7t8r1
DiNapoli, T. P., & Jain, R. (2024). The Cost of Living in New York City: Transportation (16–2025). Office of the New York State Comptroller. https://www.osc.ny.gov/files/reports/pdf/report-16-2025.pdf
Dong, H. (2021). Exploring the Impacts of Zoning and Upzoning on Housing Development: A Quasi-experimental Analysis at the Parcel Level. Journal of Planning Education and Research, 44, 0739456X2199072. https://doi.org/10.1177/0739456X21990728
Durning, A. (2021, March 25). Yes, Other Countries Do Housing Better, Case 1: Japan. Sightline Institute. https://www.sightline.org/2021/03/25/yes-other-countries-do-housing-better-case-1-japan/
FreddieMac. (2024). U.S. Economic, Housing and Mortgage Market Outlook. FreddieMac. https://www.freddiemac.com/research/forecast/20241126-us-economy-remains-resilient-with-strong-q3-growth
Freemark, Y. (2023). Achieving Housing Abundance Near Transit. Terner Center for Housing Innovation, UC Berkeley. https://ternercenter.berkeley.edu/research-and-policy/housing-abudance-near-transit/
Garcia, D., Carlton, I., Patterson, L., Strawn, J., & Metcalf, B. (2024). Making Missing Middle Pencil: The Math Behind Small-Scale Housing Development. Terner Center for Housing Innovation, UC Berkeley. https://ternercenter.berkeley.edu/research-and-policy/making-missing-middle-pencil-the-math-behind-small-scale-housing-development-2024/
Haas, P., Morse, S., Becker, S., Young, L., & Esling, P. (2013). The influence of spatial and household characteristics on household transportation costs. Research in Transportation Business & Management, 7, 14–26. https://doi.org/10.1016/j.rtbm.2013.03.004
JCHS. (2024). The State of the Nation’s Housing 2024. Joint Center for Housing Studies of Harvard University. https://www.jchs.harvard.edu/state-nations-housing-2024
Litman, T., & Pan, M. (2025). TDM Success Stories: Examples of Effective Transportation Demand Management Policies and Programs, and Keys to Their Success. Victoria Transport Policy Institute. https://www.vtpi.org/tdmss.pdf
Manji, S., & Finnigan, R. (2023, August 3). Streamlining Multifamily Housing Production in California: Progress Implementing SB 35. Terner Center for Housing Innovation, UC Berkeley. https://ternercenter.berkeley.edu/research-and-policy/sb-35-evaluation/
Manji, S., & Ozer-Bearson, R. (2024). Pro-Housing Designation Programs: How States are Incentivizing Pro-Housing Reform. Terner Center for Housing Innovation, UC Berkeley. https://ternercenter.berkeley.edu/research-and-policy/pro-housing-designation-programs-how-states-are-incentivizing-pro-housing-reform/
Manville, M., Beata, A., & Shoup, D. (2013). Turning Housing Into Driving: Parking Requirements and Density in Los Angeles and New York. Housing Policy Debate, 23(2), 350–375. https://doi.org/10.1080/10511482.2013.767851
Manville, M., & Pinski, M. (2020). Parking behaviour: Bundled parking and travel behavior in American cities. Land Use Policy, 91, 103853. https://doi.org/10.1016/j.landusepol.2019.02.012
Markley, S. N., Holloway, S. R., Hafley, T. J., & Hauer, M. E. (2022). Housing unit and urbanization estimates for the continental U.S. in consistent tract boundaries, 1940–2019. Scientific Data, 9(1), Article 1. https://doi.org/10.1038/s41597-022-01184-x
Miner, P., Smith, B. M., Jani, A., McNeill, G., & Gathorne-Hardy, A. (2024). Car harm: A global review of automobility’s harm to people and the environment. Journal of Transport Geography, 115, 103817. https://doi.org/10.1016/j.jtrangeo.2024.103817
Ridlington, E. (2023, May 19). Less driving is possible. Frontier Group. https://frontiergroup.org/resources/where-people-drive-less-than-they-used-to/
Romem, I. (2018, February 1). Islands of Density in a Sea of No-Growth. MetroSight. https://metrosight.com/articles/islands-of-density-in-a-sea-of-no-growth
Russell, J. (2025, February 16). A Mandate for Boston’s Suburbs: Make Room for More Apartments. The New York Times. https://www.nytimes.com/2025/02/16/us/boston-zoning-housing-apartments.html
Subin, Z. (2024, October 9). How much can new housing contribute to state climate action? Terner Center for Housing Innovation, UC Berkeley. https://ternercenter.berkeley.edu/blog/how-much-can-new-housing-contribute-to-state-climate-action/
Subin, Z. M., Lombardi, J., Muralidharan, R., Korn, J., Malik, J., Pullen, T., Wei, M., & Hong, T. (2024). U.S. urban land-use reform: A strategy for energy sufficiency. Buildings & Cities, 5(1). https://doi.org/10.5334/bc.434
Thomas, T. N. (2025). Eliminating Zoning Barriers to Affordable Housing (HUD Exchange). Smart Growth America; National Association for Latino Community Asset Builders. https://web.archive.org/web/20250117222053/https://files.hudexchange.info/resources/documents/Eliminating-Zoning-Barriers-to-Affordable-Housing-Guidebook.pdf
Endnotes
[1] Our analysis includes all 50 states except Alaska and Hawaii, as well as the District of Columbia as a separate “state.”
[2] In this figure and subsequent ones, pre-1940 represents the count of housing stock that existed in a given geography in 1940. To facilitate comparisons across decades, we have adjusted the 2011–-2019 housing counts by multiplying them by 10/9, assuming a simple continuation of linear growth.
[3] While our analysis ends in 2019 due to data limitations, the pandemic triggered modest out-migration from some urban cores to their suburbs and to smaller metro areas, with uncertain implications for long-term trends in housing development.
[4] Here and in Figure 3, “metropolitan regions” refers to combined statistical areas.
[5] While these metro regions have performed relatively well compared with other U.S. regions, that does not mean they are building enough housing to achieve broad affordability in walkable neighborhoods. Some international cities, such as Tokyo and Auckland, are building new homes (per capita) at a pace rarely matched in North America.
[6] The Historical Housing Unit and Urbanization Database 2010 provides open-access housing unit estimates, harmonized onto 2010 census tracts by Markley et al. (2022).
[7] We approximated 2023 average VMT per resident as the simple average of Replica’s “spring” and “fall” (i.e., first half and second half of the year) estimates; each of these, respectively, was approximated as 5/7 times Replica’s “typical Thursday” plus 2/7 times its “typical Saturday.”
Share This Post:
Related Articles
U.S. Senate Banking Committee Advances Bipartisan Legislation to Accelerate Housing Supply
Authors: Ben Metcalf, Terner Center Managing Director David Garcia, Terner Center Affiliate On July 29, the U.S. Senate Banking Committee…

Who is Served by the Housing Choice Voucher Program? A State- and County-Level Look
Authors: Christi Economy and Ryan Finnigan The Housing Choice Voucher (HCV) program has consistently been shown to increase housing security,…
Supporting the Implementation of CalAIM within Permanent Supportive Housing
In 2022, California embarked on an ambitious effort to improve its Medi-Cal system—the state’s Medicaid program that insures nearly 15…
Property Tax Exemptions to Facilitate Affordable Housing: Lessons from California
This brief explores increasing the use of property tax exemptions as a way to enable new construction and preserve affordable…
