Understanding the Role of New Housing in Reducing Climate Pollution
Published On March 12, 2024
Author: Zack Subin
Whether and how new housing is built has important consequences for the climate. Improving urban land use policy is an important way to reduce global climate pollution (what is commonly referred to as “climate mitigation”). It is likely essential for reaching global climate targets, and it may decrease environmental and social harms of expanded lithium mining as we transition to electric cars.1
As the Terner Center recently reviewed, both building infill housing in existing communities and building denser housing types—such as apartments and fourplexes—tends to reduce climate pollution. These types of housing help use energy, land, and materials more efficiently, systemically reducing climate pollution throughout the lifecycle of a building. However, these benefits can be difficult to quantify for individual projects or city plans, as they intersect with the wider housing market: the largest pollution reductions are expected when alleviating housing shortages in energy-efficient neighborhoods. With a more complete understanding of the benefits of infill housing and other climate mitigation options, policymakers and homebuilders could better prioritize the most important ones, leaving them greater flexibility to address other housing policy objectives at the same time.
The climate benefits of infill housing
Infill housing reduces pollution by reducing driving. As we illustrate in a Bay Area example below, people living in San Francisco drive on average one third that of people living in Oakley. More generally, vehicle miles traveled (VMT) by residents of a neighborhood are higher at lower population density, along a spectrum from urban core to outlying suburban and rural neighborhoods (Figure 1).
Figure 1: Vehicle Miles Traveled by California Residents, Spring 2023
Note: the population-weighted state average in these data was 22 vehicle miles traveled per person, per day.
Source: Author’s calculations of Replica California-Nevada data.2
These driving patterns result from the trips people take every day, what modes of transportation are available to them, and how far away are the destinations they wish to reach.
To illustrate these, we looked at travel patterns across four cities in the Bay Area—San Francisco, Palo Alto3, Hayward, and Oakley—in the Spring of 2023. We analyzed data from Replica, which provides current estimates of trips based on mobile device locations, down to the neighborhood scale. On average, people living in these four cities made a similar number of trips and for the same reasons, such as commuting to work, going out to eat, and shopping (Figure 2).
Figure 2a: Daily Trips by Bay Area Residents, Spring 2023 Source: Author’s calculations of Replica California-Nevada data.
Figure 2b: Daily Trips by Bay Area Residents, Spring 2023 Source: Author’s calculations of Replica California-Nevada data.
Figure 2c: Daily Travel Distance by Bay Area Residents, Spring 2023 Note: The share of miles traveled (this figure) by walking and biking modes of transit is small relative to their share of trips (previous figure) as the typical trip distance is short for these modes.
Source: Author’s calculations of Replica California-Nevada data.4
Figure 2d: Greenhouse Gas Emissions from Passenger Vehicles by Bay Area Residents, Spring 2023 Note: Air travel is excluded.
Sources: Author’s calculations of: Replica California-Nevada data; California GHG Inventory and FHWA Tables VM-2 and VM-1 for estimating tailpipe emission factor; CARB LCFS lifecycle analysis for fuel production emission factor; and ICCT lifecycle analysis for vehicle manufacturing emission factor.
What did vary across residents in different cities was how they made those trips, and how far they had to travel. In San Francisco, 11 percent of trips were via transit, compared to less than 1 percent in the other three cities (Table 1). Moreover, people in San Francisco walked or biked for 31 percent of their trips, compared with 22 percent in Palo Alto and just over 10 percent in Hayward and Oakley. Finally, the median trip length varied across the four cities from 2.4 miles in San Francisco to 4.4 miles in Oakley.
Table 1: Bay Area Resident Transportation Metrics, Spring 2023
| Metric (city average) | San Francisco | Palo Alto | Hayward | Oakley |
|---|---|---|---|---|
| Population density (people per square mile) | 18,629 | 2,846 | 3,557 | 2,733 |
| Vehicle miles traveled (miles per person per day) | 10 | 15 | 21 | 30 |
| Car mode share (% of trips) | 58% | 77% | 87% | 89% |
| Transit mode share (% of trips) | 11% | 1% | 1% | 0% |
| Walk, bike, and other active mode share (% of trips) | 31% | 22% | 12% | 11% |
| Mean trip length (miles) | 7.1 | 7.6 | 9.0 | 12.2 |
| Median trip length (miles) | 2.4 | 2.7 | 3.7 | 4.4 |
| Commute trip share (% of trips)5 | 20% | 18% | 19% | 17% |
| Commute travel share (% of miles traveled) | 26% | 27% | 27% | 31% |
| Direct (tailpipe only) greenhouse gas emissions from personal transportation (tons CO2-equivalent per person, per year) | 1.4 | 2.1 | 2.8 | 4.1 |
| Total greenhouse gas emissions from personal transportation (tons CO2-equivalent per person, per year) | 2.3 | 3.5 | 4.7 | 6.8 |
Sources: Author’s calculations of Replica data; greenhouse gas emissions estimated as in Figure 2d; U.S. Census QuickFacts (year 2020).
Due to the combination of these three factors, people living in Oakley drove three times as much as people in San Francisco with an average of 30 miles per person per day.6 In between, Palo Alto averaged 15 and Hayward was near the 13-county Bay Area average of 20 miles per person per day. Non-work trips were largely responsible for these patterns: in all four cities, no more than 31 percent of those miles were commuting to and from work.
These travel patterns translate to large differences in carbon pollution. An average San Francisco resident would emit 2.3 tons CO2-equivalent per year from driving, while an average Oakley resident would emit 6.8 tons.7 For comparison, the average carbon footprint for California residents from all emissions sources is about 17.6 tons, so the difference in the amount of driving from Oakley to San Francisco equates to 26 percent less emissions overall.8
Intersection of driving patterns with the housing shortage
The large pollution savings associated with living in San Francisco are unavailable if new housing growth continues to be pushed to more outlying suburban places like Oakley. Current patterns are due to the fact that places like San Francisco are not building enough homes, while eastern Contra Costa County is (Figure 3). Indeed, eastern Contra Costa County has become the home of many Black and Latine residents priced out of the Bay Area’s urban core.
Figure 3: Housing Permitted in California Note: Oakley data are unavailable in the US Building Permit Survey prior to 2000.
Source: US Building Permit Survey data pre-2018 and California Housing and Community Development Annual Progress Report data 2018-onwards. Five-year averages are shown except for 2020-2022. Via housing.data.app.
If building new homes in San Francisco displaces demand for building in Oakley and other car-oriented locations on a one-for-one basis, this analysis would suggest a quarter reduction in overall climate pollution per person would be achieved relative to the state average. And this reduction is solely from transportation efficiency, before considering the potential for other types of pollution savings coming from building more efficient homes on less land, or using green building techniques.
Under these assumptions, the savings would be nearly as large for new housing in Palo Alto as they would in San Francisco. Yet, some recent state legislation aimed at increasing the supply of housing throughout the state, such as Assembly Bill 2097 of 2022, does not apply to much of Palo Alto, due to large sections of the city falling outside a half mile of a “major transit stop.” As nearly all of Palo Alto is considered to be high (or highest) resource areas in the state’s opportunity map, the city is an example where climate and equity motivations for infill housing are well-aligned.
Similarly, a 2018 study by UC Berkeley and Davis researchers found that building infill housing in San Francisco, Palo Alto, and many other California cities would be the most potent climate action available to local policymakers. Local climate action plans rarely emphasize infill housing—and even more rarely do they quantify its carbon benefits as they do for other measures such as heat pump or electric car adoption. Recent plans for San Francisco and San Diego were notable examples where infill housing was identified as a strategy but without comprehensively quantifying the potential carbon benefits. Not only are these action plans an important opportunity for local public engagement around climate policy, they are also required for some forms of CEQA (California Environmental Quality Act) project review streamlining. The state government has also underlined the importance of infill housing as a local action in support of state climate goals, and Senate Bill 768 proposes that state agencies further investigate the interrelationship of housing, transportation, and climate.
Better metrics underpinned by new research are needed
An important reason that cities have not quantified the carbon benefits of infill housing in their climate plans may be the lack of data tools for doing so. Though these benefits are likely large, they are more challenging to estimate under conventional approaches. For example, San Francisco’s local emissions would increase as new housing and residents are added, even though at a regional scale, overall emissions would decrease, since San Francisco’s residents emit less than the regional average. Integrated climate, housing, and transportation planning at the regional or statewide scales would make the benefits of infill housing easier to quantify, but this planning must be reflected in local land use policy for it to be effective.9 Without accounting for the larger scale impacts of local decisions, local climate policies may miss opportunities to reduce emissions—and risk making both carbon pollution and housing affordability worse if they act to constrain new housing supply.
But understanding the impacts of new housing in San Francisco is also complicated by housing market dynamics. The key assumption in the carbon analysis above was that one additional home in San Francisco would avoid one new home built in Oakley, but household location decisions are complex. Some research suggests this is a good assumption, as new housing in San Francisco would satisfy unmet demand for living in walkable neighborhoods. But little or no research has directly addressed this question; few if any North American cities have maintained true housing abundance throughout their urban cores in the last half century, so there are scant examples for study.
Integrated housing and energy systems research could aim to build a more complete understanding of how new housing decisions affect climate pollution. For a given new housing project, this would depend on the location, the housing type, and the building and appliance characteristics, as well as the household composition and behavior of the new residents themselves. Crucially, it would also depend on what would have happened if this new housing was not built. In contrast, much existing climate planning and environmental impact analyses implicitly assume that people (or at least their environmental impacts) would simply disappear if homes were not built for them locally.
Informing housing policy tradeoffs
A more complete quantitative understanding of the carbon impacts of new housing—including taking into account housing equity challenges—would help localities prioritize housing policies and effectively balance complicated tradeoffs. Instead, policymakers and homebuilders attempting to align new housing with climate policy too often face an extensive checklist that lacks prioritization: must every new home be zero net energy, LEED-certified, built with low-carbon materials, parking-light and EV-ready, and steps away from a train station?10 And this checklist is before layering on climate resilience criteria such as fitting with backup batteries and avoiding areas prone to floods, wildfires, and heat waves.
Such a lengthy checklist may be incompatible with the pace of housing production California needs in order to solve the housing affordability crisis. Housing policymakers also must prioritize additional important policy goals such as affirmatively furthering fair housing.
Among the goals of Terner Center’s new Housing + Climate research initiative is advancing the climate data tools available for housing policy, so that strategies for making new housing affordable and climate-friendly can be better aligned. We aim to address questions such as: under what conditions can building homes in communities lacking transit infrastructure—or even in greenfield locations—be compatible with climate goals? Is California’s housing shortage causing out-migration to places in the country that create more carbon pollution and are more vulnerable to climate impacts? Are recent California building energy code requirements adding upfront costs that reduce new housing production?
While we work to build a more complete understanding of housing and climate pollution dynamics, policymakers continue to grapple with these challenges today. Building more housing in coastal cities like San Francisco and Palo Alto likely yields large reductions in pollution, critical for meeting the state’s climate goals. Recent California land use reforms such as Senate Bill 35 (passed in 2018 and expanded by Senate Bill 423 in 2023) coupled with the strengthened housing element process may help to unlock these benefits, but continued attention from policymakers will be needed to ensure that cities follow through on their commitments and that new housing is financially feasible to build.
Acknowledgements
I would like to thank the Wells Fargo Foundation for seeding the Terner Center’s new Housing + Climate research initiative. I would like to thank Carolina Reid, Ben Metcalf, and David Garcia for their reviews of this commentary, Quinn Underriner for his support with the interactive map, and Cora Johnson-Grau and Shiori Green for editing and layout. I also would like to thank Lauren Massey and Emily Lucas from Replica for their assistance with documentation and data access, and Sid Kapur for developing the “housingdata.app” dashboard and providing custom functionality used in this commentary.
This commentary solely reflects the views of the author and does not represent the position of the Terner Center for Housing Innovation, UC Berkeley, or its funders. Funders do not determine research findings or recommendations in Terner Center’s research and policy reports.
Endnotes
- More fundamentally, electric vehicles are necessary but insufficient to reduce transportation carbon pollution at the pace needed; reduction in vehicle travel is also crucial.
- We estimated the seasonal average as 5/7 times Replica’s representative Thursday plus 2/7 times the representative Saturday. The megaregion estimate was last updated September 2, 2023.
- Note that the city of Palo Alto does not include the Stanford University campus.
- “Car” means light-duty passenger car, light truck, SUV, or motorcycle, and includes trips as a passenger and in a taxi or ride-hailing vehicle. We exclude 1 percent of trips classified as “Other” mode which contain outliers such as air travel. “Walk or bike” includes some other active transportation modes such as the use of electric bikes and mobility assist devices, though Replica does not include scooter trips; only active transportation trips intended to reach a destination are included (i.e., a walking or biking loop for exercise would not be included). Note that residential VMT would relate to the passenger travel here divided by the average vehicle occupancy.
- Commute trip share and travel share ignores trip chaining and assigns trips returning home proportionally to each of the other trip purposes.
- A fourth factor contributing to especially low VMT in San Francisco was a higher carpool share than the other three cities.
- These estimates include gasoline and vehicle production emissions, some of which occur outside California.
- The 17.6 tons is based on a “consumption emissions” accounting, allocating most emissions sources to goods and services ultimately consumed by households, including those occurring elsewhere in the world associated with imported food, energy, and other goods. This is the most appropriate comparison point for analyzing the global emissions impacts of where people live. However, the 17.6 ton estimate from the CoolClimate calculator (California average household divided by the calculator default of 2.5 people per household) includes some pre-2014 data vintages and may not reflect California’s most recent progress reducing electricity emissions. For comparison, under a more common direct emissions accounting (of emissions physically occurring within the state’s borders) typically used in state policy, 9.7 tons were emitted per Californian in 2021.
- This is an objective of California’s Sustainable Communities law that the Air Resources Board acknowledges has not been sufficiently achieved.
- The strongest case for a non-negotiable checklist item might be for requiring all-electric new homes. Fitting new homes with fossil fuel infrastructure is likely incompatible with climate commitments, typically more expensive (especially under California’s recent rule change), and risks saddling residents with future upgrade costs or escalating gas rates as the gas system winds down.
Share This Post:
Related Articles
Student Capstone Projects
As part of our commitment to the education and professional development of UC Berkeley students, the Terner Center highlights exceptional…

Lessons from California’s Statewide Efforts to Affirmatively Further Fair Housing
To counter the impacts of decades of discriminatory housing policies and worsening racial segregation, the State of California established a number of Affirmatively Furthering Fair Housing (AFFH) strategies. Designed to foster racially and economically inclusive, opportunity-rich communities, these efforts were intended to facilitate effective local fair housing planning and enacting statewide policies to promote integrated communities. A new Terner Center policy brief highlights key AFFH strategies, noting areas of progress and where additional efforts are needed. It examines California’s successes and challenges since 2016, offering recommendations for other states working toward fair housing goals.

Addressing the Housing Needs of Low-Income Households in the Bay Area: The Importance of Public Funding
This policy brief explores how public funding can address the San Francisco Bay Area's housing affordability crisis by increasing the…

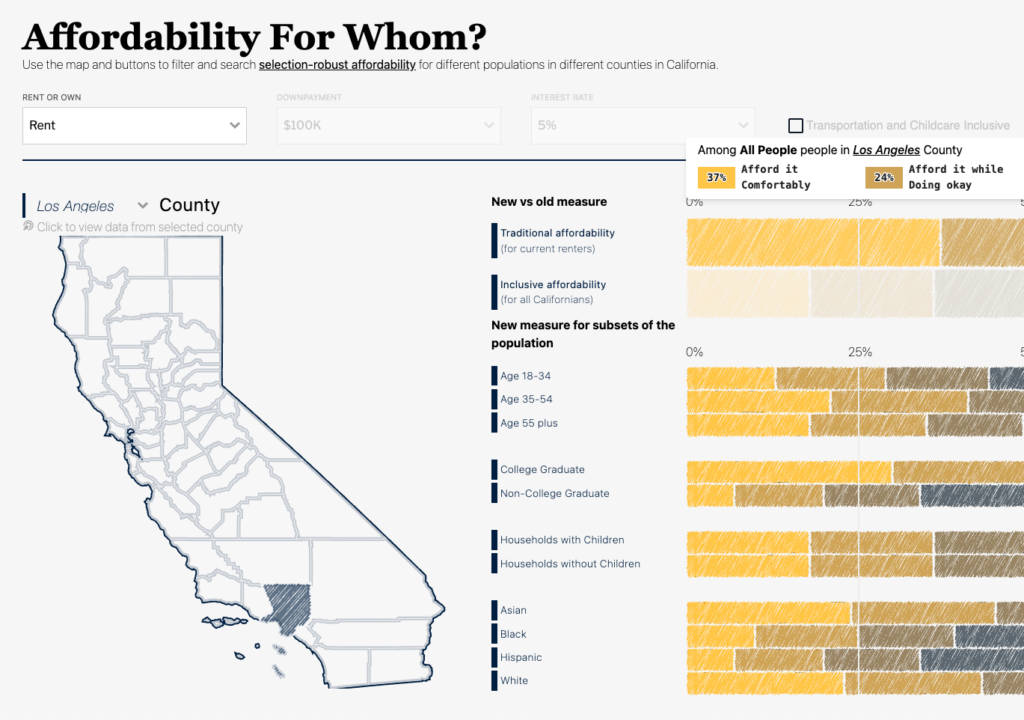
Affordability for Whom? Introducing an Inclusive Affordability Measure
This paper presents a new approach to measuring housing affordability—one that seeks to provide a better indicator of what counties…