Urban Revival? Not for Most Americans
Published On March 30, 2016
The U.S. population is now less urban than before the start of the housing bubble. While well-educated, higher-income young adults have become much more likely to live in dense urban neighborhoods, most demographic groups have been left out of the urban revival.
In recent years, numerous studies and media reports have documented that college-educated young adults have been drawn to urban centers. At times some have claimed a broader demographic reversal in which cities grow faster than suburbs, and even the end of the suburbs.
But, in fact, the U.S. continues to suburbanize. The share of Americans living in urban neighborhoods dropped by 7%, from 21.7% in 2000 to 20.1% in 2014. Even looking at only the densest urban neighborhoods where about one-third of the urban population lives, the share of Americans living in these neighborhoods fell by 5%, from 7.4% in 2000 to 7.0% in 2014. (See note at end of post for details on data, methodology, and definitions.) Headlines about educated young adults flocking to Brooklyn and San Francisco aren’t wrong – but they are far from the whole story and are unrepresentative of broader trends. Other demographic groups are suburbanizing faster than the young and rich are piling in to cities.
This post looks at the change in urban living for detailed demographic groups, using individual-level data from the Census. The findings are consistent with analyses of the most recent county data and of detailed neighborhood data, both of which confirm that the American population overall continues to suburbanize. What’s new is that individual-level data show us how skewed the urban revival is toward rich, young, educated Whites without school-age kids.
People aren’t urbanizing, but money is
Urban neighborhoods – especially higher-density urban neighborhoods – grew richer between 2000 and 2014. But only higher-income households became more urban over these years. The poorest tenth of households was 12% less likely to live in urban neighborhoods in 2014 compared with 2000, and 17% less likely to live in higher-density urban neighborhoods. In contrast, the richest tenth of households was 12% more likely to live in higher-density urban neighborhoods, and only 1% less urban overall in 2014 than in 2000. The top four income deciles were all more likely to live in higher-density neighborhoods in 2014 than 2000, while none of the bottom six were.
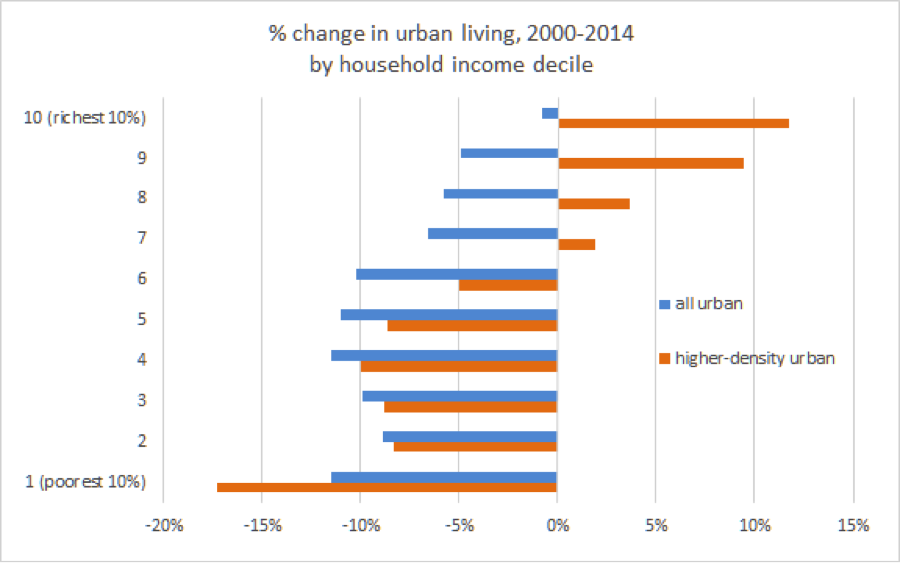
The suburbanization of the poor and urbanization of the rich was enough to raise the share of total household income going to higher-density urban neighborhoods. Although the share of the total population living in higher-density urban neighborhoods fell by 5% between 2000 and 2014, as noted above, the share of total national household income received by households in higher-density urban neighborhoods rose by 6%.
Urban neighborhoods are increasingly young, rich, childless*, and white
Cities have gotten younger since 2000. But that’s not because Millennials – those age 18-33 in 2014 — are an especially urban generation.
The only age group that has become more urban since 2000 is 35-39 year-olds, who in 2014 were 2% more likely to live in urban neighborhoods and 9% more likely to live in higher-density urban neighborhoods. (In addition, 40-44 year-olds are ever so slightly more likely to live in urban neighborhoods, by 0.1%.)
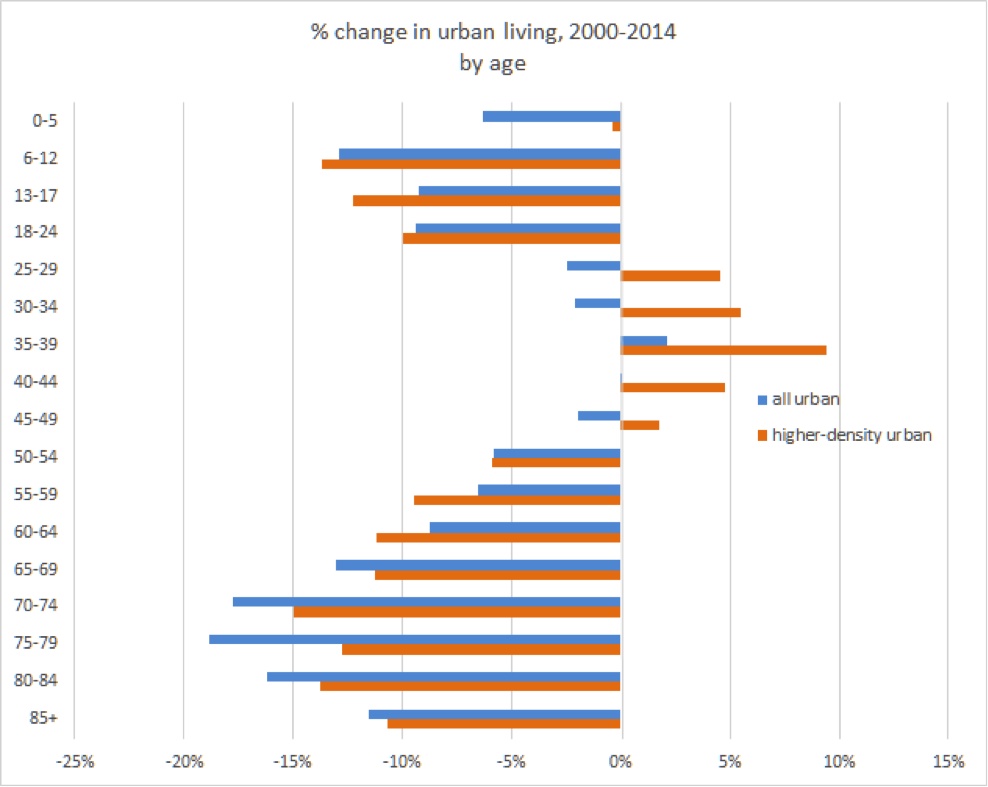
While older Millennials (roughly, the 25-29 and 30-34 age groups) are more likely to live in higher-density urban neighborhoods, younger Millennials – age 18-24 – are 9% less likely to live in an urban neighborhood and 10% less likely to live in a higher-density urban neighborhood in 2014 than in 2000. Since many 18-24 year-olds live in college dormitories and even more live with their parents, we can look at only those 18-24 year-olds who are not in school and not living with relatives. The answer is similar: fewer lived in urban (or higher-density urban) neighborhoods in 2014 than in 2000, though the decline is less steep than when all 18-24 year-olds are included.
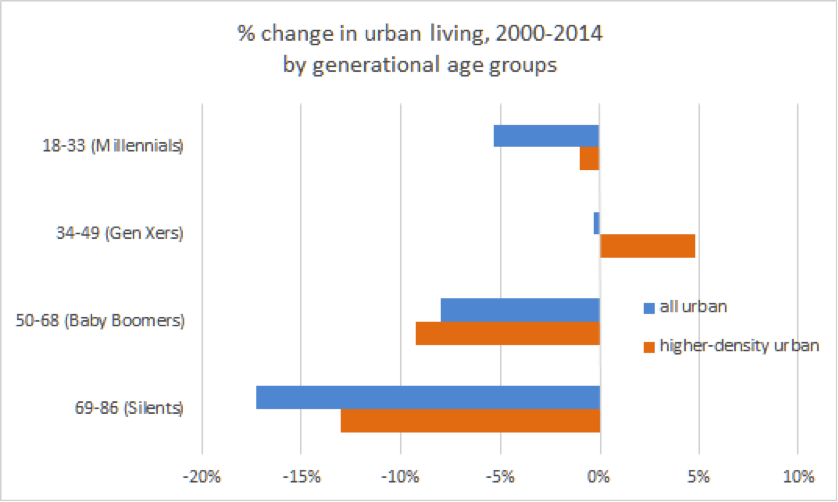
In fact, among the four main generations as commonly defined, only Gen Xers were more likely to live in higher-density urban neighborhoods in 2014 than their same age group was in 2000.
Let’s focus on the 25-49 year-olds, which includes all of the age groups more likely to live in higher-density urban neighborhoods in 2014 than in 2000. Even within this group, the trend toward urban living is limited to those with college degrees, and those without school-age children. Within this age group, people with four or more years of college were 5% more likely to live in urban neighborhoods in 2014 than in 2000, and 17% more likely to live in higher-density urban neighborhoods – a big increase. But only one-third of adults 25-49 have four or more years of college. The other two-thirds, including those with no college at all, became less urban over this period.
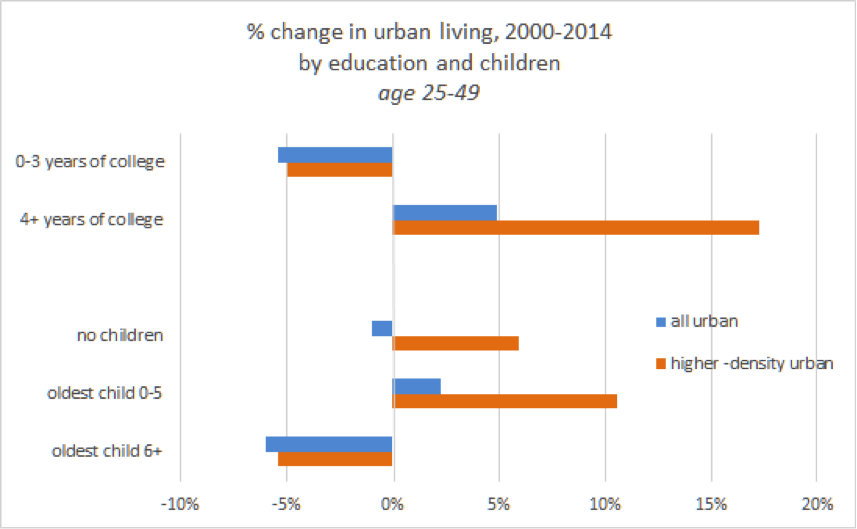
The urban revival has also left out adults with school-age kids. 25-49 year-olds with a child age six or older were 6% less likely to live in urban neighborhoods (5% less likely in higher-density urban neighborhoods). Even among 25-49 year-olds with four or more years of college, those with kids age six or older were 6% less likely to live in urban neighborhoods in 2014 compared with 2000, and only a bit more likely (2%) to live in higher-density urban neighborhoods. Another way to see this is that the school-age kids themselves — 6-12 and 13-17 year-olds — were less urban in 2014 than in 2000, as the earlier chart shows.
Two final points reinforce that we can’t generalize about young people becoming more urban. The 25-49 year-olds in the bottom tenth of the overall income distribution were 18% less likely to live in urban neighborhoods and 27% less likely to live in higher-density urban neighborhoods in 2014 than in 2000. In contrast, 25-49 year-olds in the top tenth of the income distribution were 11% more likely to live in urban neighborhoods and a whopping 33% more likely to live in higher-density urban neighborhoods in 2014 than in 2000.
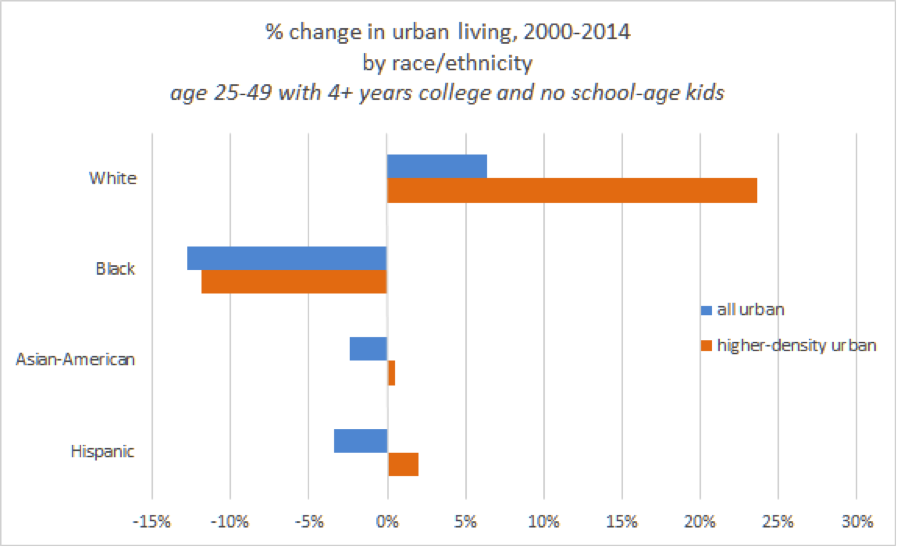
Lastly, the urban revival is overwhelmingly about Whites, even after accounting for racial and ethnic differences in education and presence of children. Among 25-49 year-olds with four or more years of college and no school-age kids, Blacks, Hispanics, and Asian-Americans were all less likely to live in urban neighborhoods in 2014 than in 2000, unlike Whites. The share of Blacks living in higher-density neighborhoods dropped 12%, and rose just 2% for Hispanics and 0.5% for Asian-Americans, compared with an increase of 24% for Whites. It remains the case that young, educated Whites without school-age kids were still less likely to live in urban or higher-density urban neighborhoods than other races and ethnicities in 2014, but the trend since 2000 has been radically different for Whites than for the other major racial and ethnic groups.
Seniors aren’t returning to cities
While the urbanization trends for young adults depend on which young adults we’re talking about, the pattern is more straightforward for older adults. The senior population has become significantly less urban. All age groups 65 and older were at least 10% less likely to live in urban neighborhoods in 2014 than in 2000; that’s true for the high-density urban neighborhoods, too. Unlike young adults, the decline in urban living among older adults is similar for those with and without college degrees. And, unlike for young adults, the decline in urban living among older adults is generally steeper for those with higher incomes.
Furthermore, it is not simply that older adults are staying in their suburban homes longer, held back by negative equity or other fallout from the housing bubble. Even among only those 65-79 year olds who have lived in their current home less than two years, the share living in urban neighborhoods dropped by 12% (and by 16% for higher-density urban neighborhoods). Nor is it that older adults are hanging onto suburban homes because their kids are living in the basement: the decline in urban living is similar among only those adults age 65-79 who live in one- or two-person households with no children of any age (including adult children).
Prior to the trends of the 2000s, older adults were already less likely than younger adults to live in urban areas. Therefore, the least urban age groups have become yet less urban. Even those who have recently moved and those who are in the position to afford expensive urban housing are increasingly living outside of urban neighborhoods.
How many cheers for the urban revival?
If the trend toward urban living is limited to some educated, young adults, why has the urban comeback gotten so much attention? It probably doesn’t hurt that many of the people writing these stories are themselves educated, young adults in dense urban neighborhoods. More seriously, though, educated, young adults are highly mobile and have disposable income, so their choices about where to live can be a strong leading indicator about broader shifts in the desire for urban living. Also, young, talented workers boost local economic innovation and productivity, especially when they – as economists like to say – agglomerate. And it’s not just those urban areas themselves that benefit. The increased clustering of talented people in productive places boosts national economic output. Plus, upscale stores and restaurants serving new urban residents are a draw for suburbanites and tourists, too. Little wonder that the urbanization of the young and educated has been celebrated.
But enthusiasm for the urban revival should be tempered by a recognition that most of America is not directly taking part. Both the poor, who traditionally have depended most on urban public services, and seniors, by far America’s fastest-growing age group, have become less urban as the young and educated have moved in. And some of the talented, educated people who would boost cities’ fortunes aren’t urbanizing much or at all, such as people with school-age kids, non-White young adults, and Baby Boomers who are nowhere near retirement. Among the majority of the population that’s becoming less urban, some might have chosen suburbs and rural areas because those places are a better fit for their needs than urban areas are. Others might have preferred to stay urban but have been outbid for housing by the young and educated, particularly in cities where onerous regulations and permitting processes have limited new construction.
To be sure, the dramatic increase in higher-density urban living among the young and educated is a strong vote in favor of life in America’s most successful cities, and it has brought disproportionately large economic benefits. Still, a three-cheer urban revival would be one in which more than just the young and educated would increasingly both want and be able to live in dense, urban neighborhoods.
Notes:
All data in this post are based on Public Use Microdata Samples (PUMS) from the 2000 decennial Census and 2014 one-year American Community Survey (ACS). PUMS files are individual-level data, which makes it possible to create custom classifications, such as 25-49 year-olds with four or more years of college and no school-age kids.
The most granular level of geography available in the PUMS file is Public Use Microdata Areas (PUMAs), each representing a little over 100,000 people. (Analyses using aggregate data can use finer geographies like ZIP codes, but with aggregate data one cannot construct custom demographic groups. Also, aggregate small-geography data is available only as 5-year averages; the latest available, the 2010-2014 5-year ACS, averages in less recent data than one can see at the PUMA level in the 2014 one-year PUMS file.)
I classified PUMAs as urban and higher-density urban based on their tract-weighted household density, which equals the average households per square mile in each Census tract within a PUMA, weighted by the number of households in the tract, according to the most recent full-count Census. PUMA definitions change over time. Therefore, the urban classification for the 2000 decennial Census sample uses PUMAs defined in 2000 and density calculated using 2000 Census household counts; the urban classification for the 2014 ACS sample uses PUMAs defined in 2012 and density calculated using 2010 Census household counts.
Urban PUMAs are those with tract-weighted density of at least 2,213 households per square mile, which is the cutoff above which, according to survey research, Americans consider their neighborhood to be urban. The cutoff for higher-density urban neighborhoods was set at 5,000 households per square mile and corresponds to the densest one-third of all urban neighborhoods. These higher-density urban PUMAs include most parts of the cities of New York, Chicago, Philadelphia, San Francisco, Boston, Washington DC, Honolulu, and Miami; downtown portions of many other big cities; and a few dense places outside of big cities, like Arlington, VA; Berkeley, CA; and Jersey City, NJ. At significantly higher cutoffs for higher-density, the set of higher-density urban PUMAs shrinks quickly and becomes dominated by neighborhoods in New York City. Nineteen of the twenty densest PUMAs in America are in New York City; all of the top ten are in Manhattan.
The analysis focuses on the change over the period 2000 to 2014. It starts in 2000 and not later in order to highlight what are more likely to be sustained shifts in living patterns. The years between 2000 and 2014 saw the extreme cycle of the bubble, bust, and recovery: the bubble years favored suburban growth, and the bust and recovery years have been, in part, a reaction and correction to the bubble. Analyses of urban and suburban patterns that cover only part of the full cycle back to 2000 risk being dominated by cyclical swings that obscure the underlying trends.
The race and ethnicity categories include those who reported one race. Two or more races, and other races, are not shown in the table. The White, Black, and Asian-American categories exclude Hispanics, who are shown as a separate category.
All data in this post were downloaded from IPUMS, which requests to be cited as: Steven Ruggles, Katie Genadek, Ronald Goeken, Josiah Grover, and Matthew Sobek. Integrated Public Use Microdata Series: Version 6.0 [Machine-readable database]. Minneapolis: University of Minnesota, 2015.


