Putting the Tool to Work: Takeaways from the Housing Development Dashboard
Published On June 23, 2016
Update December 2022: please see the Terner Center & Labs’ updated approach to policy simulation modeling using the new Terner Housing Policy Dashboard on our website here.
The Terner Center’s recent release of the Housing Development Dashboard was met with enthusiasm from media outlets, practitioners, and policymakers, all commenting on its important contribution to our understanding of local housing production and related policies. I want to share some of my biggest takeaways from the Dashboard, to illustrate why and how I think it can provide critical insight into these issues, and help to pave a way forward in addressing our housing challenges in the Bay Area and eventually, nationwide.
In many ways, the Dashboard validates, and provides evidence for, much of my intuition (honed from a career in local and federal public service and affordable housing development in California) around the challenges and opportunities in housing policy. At a high level, the Dashboard confirms three key things:
- A locality’s zoning is a critical factor in calculating the impact specific policy levers – such as changes to density and parking requirements – might have on housing production.
- Underlying market conditions (such as construction costs and rents) play the largest role in determining project feasibility. If policymakers do not adequately consider economic feasibility, policy responses will be inadequate or have unintended consequences.
- Inclusionary housing policies, in particular, are sensitive to the way market factors and other local planning policies interact in a place. When assessing their potential impact, inclusionary policies should be looked at in terms of the way they both affect, and in turn are affected by, these factors.
The importance of zoning
The Policy Gauge part of the Dashboard demonstrates that for some communities, go-to policy levers like increasing density or reducing parking ratios may be necessary, but on their own totally insufficient, for these types of communities to contribute their fair share to new residential development. Why? Because zoning in such communities overwhelmingly favors the development of single family homes. Consequent to this, current planning practices simply won’t generate a sufficient amount of multifamily housing to make a difference; applying all other policy levers (e.g. density and parking) in these communities just won’t move the dial.
Let’s take the examples of Menlo Park and San Francisco as two extremes. The Policy Gauge shows us that Menlo Park has a baseline potential to add between 70 and 459 more housing units on top of its current count of 13,313. If you take the midpoint of that range (264 units), Menlo Park’s housing stock increases by less than 2 percent!
Looking at the same question in San Francisco, you get a very different picture. San Francisco has a baseline potential to add between 34,771 and 40,214 housing units to its current total housing stock of 372,560 units. Using the midpoint of 37,492, you see there is a 10% potential increase in the overall housing stock in San Francisco. While Menlo Park is a much smaller community and certainly couldn’t be expected to contribute as much new housing as San Francisco, its baseline zoning still leaves its’ housing production woefully, and proportionally, inadequate.
The concurrent importance of market forces
The above takeaway articulates why more appropriately zoned land improves the relative impact of policy levers. Meanwhile, underlying market conditions are also a significant variable, and influence development feasibility. The Dashboard shows that there is a highly sensitive interaction between policy levers and market conditions, and this interaction should be closely examined as part of the policy dialogue.
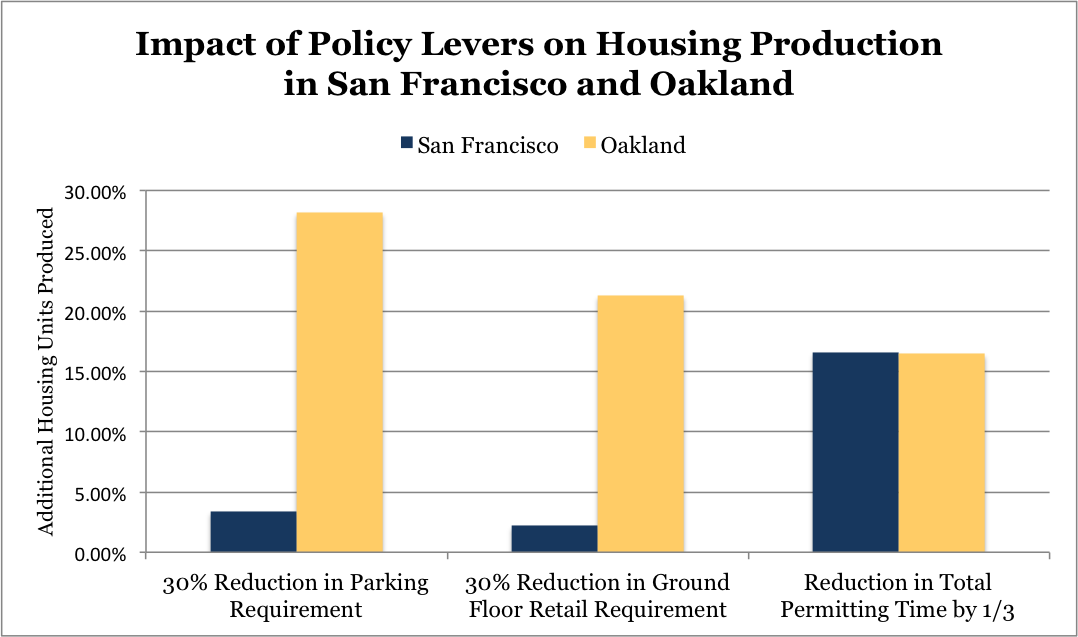
Let’s break that down by comparing San Francisco and Oakland. These communities both have a much larger share of appropriately zoned land (than, say, Menlo Park). The costs involved in production (e.g. construction and labor) are also similar. However, the application of the same policy lever (such as 30% reduction in parking or 40% increase in density) in these two jurisdictions will not produce the same results in terms of number of housing units built. Why?
Because variations in local market conditions, such as rents, heavily shape the feasibility of a development in that place. Although the Development Calculator doesn’t yet show project development probabilities by jurisdiction, it does show exactly how these market factors change the development calculus. Though there is a boom in interest, more projects and sites are still marginal for new development in Oakland because Oakland’s market isn’t in the same place as San Francisco; an identical development won’t have the same odds of getting constructed in each city, nor will it have equal odds in different neighborhoods within the same city.
Returning to the Gauge, we can see that adjustments to Oakland’s parking and retail requirements will make a huge difference there because it lowers the cost of development – making lower market rents more feasible (see chart below). In San Francisco on the other hand, policy levers such as a reduction in permitting time would actually have a much greater impact, relative to other levers. These variations can be accounted for in three ways:
- The market in San Francisco can absorb existing costs better.
- San Francisco has already taken steps to decrease parking ratios, for example, so lowering them further more has less impact.
- Timelines for approval and permitting are currently so long in San Francisco that decreasing them, by for example, 33%, makes a substantial difference.[1]
Ultimately, the Dashboard shows that existing zoning rules and underlying market conditions interact in idiosyncratic ways depending on the place. When considering what policies to apply in that place, and the impact those policies might have on overall housing production, it is essential to understand, and look closely at, this market-policy interaction. My third biggest takeaway, focusing on affordable housing inclusionary and in-lieu fee ordinances, underscores this idea.
Inclusionary: not a standalone policy
The Dashboard tells two stories: one about the influence of policy and market conditions on housing production overall, and the other about the influence of these factors on affordable housing in particular. When assessing the impact inclusionary ordinances might have, we need to look carefully at how market forces and policies are converging and how this will affect, and be affected by them.
Let’s take a couple more specific examples. The City of Oakland adopted a policy that made upward adjustments to the income levels served (up to 120% of area median income) so that more developments could be economically feasible. The Dashboard predicts this will result in the production of more affordable units than if a lower affordability standard were in place, and that they will likely be built on-site. This is not perhaps what advocates expect, but it certainly supports a closer examination of inclusionary stipulations.
Oakland also, wisely, doesn’t have a one-size-fits-all policy for every neighborhood within its borders, instead accommodating differing market conditions at a smaller scale. If the City were to adopt a parking ratio of 30 percent and reduce ground floor retail requirements by 30 percent, it could increase housing production by 64 percent, including a 57 percent increase in affordable housing, as the below graphic shows.
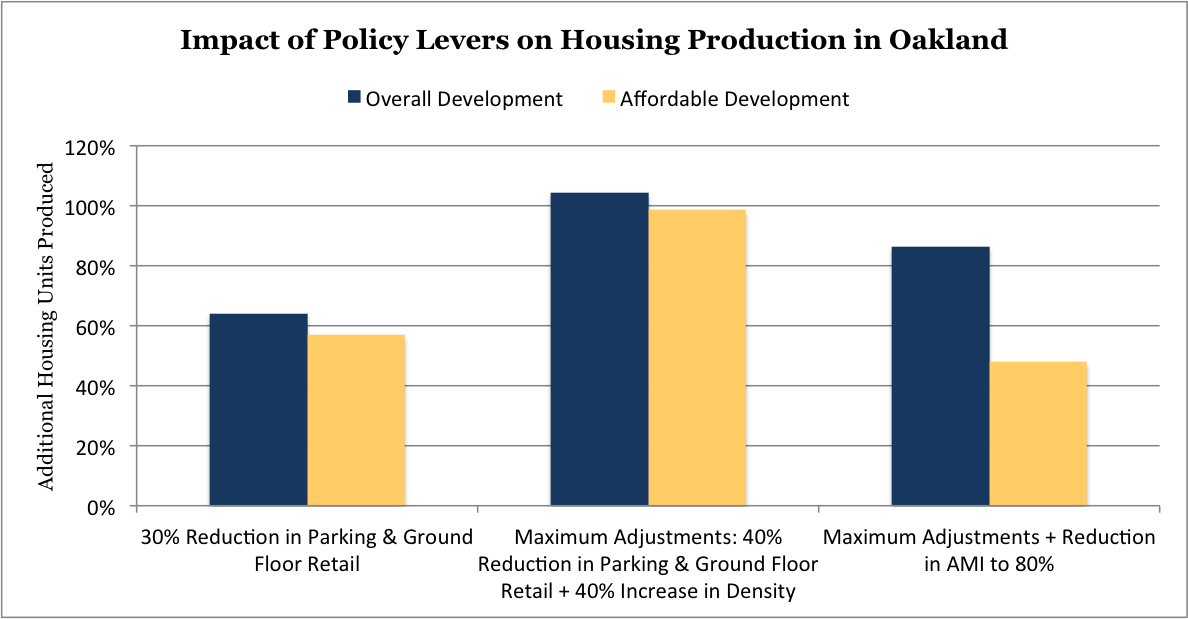
To put a finer point on it, maxing out these levers while simultaneously increasing density by the maximum amount as well, with existing inclusionary policies in place, could result in nearly 100% more housing production, including of affordable units. Adopting more expansive inclusionary policies alone would not have this magnitude of outcome. Furthermore, if you implemented these other policy levers, it would also be feasible to lower income levels for affordability targets without significantly impacting the number of units that get built.
Oakland’s case illustrates the importance of drilling down into not just the intent of these policies, but their impact when considered in context of current market conditions, and policies already in place on the ground. Ultimately, just “piling on” inclusionary requirements without looking at these market and policy interactions will backfire (less, and less affordable units, will get built overall and fewer fees will be paid).
In experimenting with the way the tool helps policymakers do this, Rachel Flynn, Director of Planning and Building for the City of Oakland noted: “The Housing Development Dashboard will help elected officials develop policies based on nuanced and relevant data – as they consider the varying opinions and viewpoints of interest groups. We look forward to putting the Dashboard to good use in Oakland.”
The Dashboard allows us to better understand current conditions and assess whether the right enabling environment is in place to address our community’s housing challenges. It positions us to chart a clearer, more informed path forward. As we look towards expanding the Dashboard, it will contribute to these efforts at the local, state, and national level, and contribute meaningfully to the future of our housing landscape.
[1] Total permitting times include both approvals and ministerial permitting. Because the proportion of time reduced (rather than number of months) is the same in both cities, it follows that the percent increase in housing units is similar in San Francisco and Oakland.
Update December 2022: please see the Terner Center & Labs’ updated approach to policy simulation modeling using the new Terner Housing Policy Dashboard on our website here.
Share This Post:
Related Articles
Reducing the Complexity in California’s Affordable Housing Finance System
Authors: Carolina Reid, Faculty Research Advisor Tiffany Tran, Graduate Student Researcher Given the critical need to expand the supply of…

Low-Income Housing Tax Credit Construction Costs: An Analysis of Prevailing Wages
Since its founding, the Terner Center has conducted research to better understand the factors driving the costs of housing development,…

Making Missing Middle Pencil: The Math Behind Small-Scale Housing Development
This brief examines the financial feasibility of building missing middle housing, such as duplexes, fourplexes, and ten-unit buildings, in California.…

Making It Pencil: the Math Behind Housing Development – 2023 Update
This brief explains the basics of how developers build new housing in California, aiming to serve as a resource for…