New State Policies Aim to Boost Access to Opportunity Through Housing
Published On December 15, 2017
In California, the Tax Credit Allocation Committee (TCAC) plays an important role in determining where and how Low Income Housing Tax Credits (LIHTC) get allocated for the production of affordable housing. On Wednesday, TCAC adopted a series of policy changes aimed at increasing the development of affordable housing options for families in higher opportunity communities, signaling a commitment to advancing fair housing goals amid the state’s broader agenda to address California’s housing crisis.
The regulations seek to respond to a growing body of evidence that communities that provide low-income families access to good schools and safer, lower-poverty, and less segregated neighborhoods improve outcomes for residents and boost economic mobility for children. However, only five percent of large family 9 percent LIHTC units (1) placed in service between 2003 and 2015 were located in the state’s most opportunity-rich neighborhoods, even though such neighborhoods account for one-fifth of the state’s census tracts. The incentives included in yesterday’s policy changes represent a concerted effort to address and begin to correct that historical imbalance.
As part of the new regulations, TCAC will rely on neighborhood-level “Opportunity Maps” to inform its allocations. These maps assign each census tract in the state to one of five opportunity categories based on a number of economic, educational, and environmental characteristics that research has shown to be important for improving outcomes for low-income children and adults.
Concerns about the methodology used to identify and assign these categories surfaced during the initial public comment period earlier this year. To respond to these issues, the Terner Center has worked in collaboration with the Fair Housing Task Force over the last several months to review and assess the methodology and propose several important improvements. These include developing a broader and more nuanced definition and categorization of rural tracts within the state, a measure of job proximity that is more reflective of regional labor market commuting patterns, and a revised employment indicator more attuned to the prime-age workforce.
But perhaps the most significant change is the development of an improved filter to identify areas of racial segregation and concentrated poverty. In the previous iteration of the maps, two filters were developed to identify what were referred to as “lowest resource” tracts: the first used an entropy index paired with a relative median income measure to identify lower-income, racially segregated tracts, and the second used a threshold based on student poverty in the three closest schools to identify high-poverty areas (i.e., tracts where 80 percent or more of students in nearby schools qualified for free or reduced price lunch). Together, these filters assigned roughly one-third of California’s census tracts to the lowest resource category, with the school poverty filter alone accounting for more than 90 percent of those assignments.
There is no doubt that schools play an important role in shaping opportunity and laying the foundation for economic mobility, which is why school metrics are included in the education domain. But the relationships between school poverty, school choice policies, and student achievement are not easily reduced to a single metric, making it a problematic filter. As a Stanford study recently found, some schools and school districts do a better job of educating low-income students, even in largely low-income areas. Our analysis of the school poverty filter yielded similar conclusions, finding that the relationship between student poverty and academic achievement varied widely across regions. Variation in school assignment policies—in some cities, children don’t attend their neighborhood school—further weakens the measure’s effectiveness in serving as a proxy for opportunity.
As a result, we worked with the Task Force to develop a new, single filter to identify neighborhoods that are both racially segregated (using a slightly different measure of segregation based on the relative proportion of racial and ethnic groups concentrated in a census tract) and areas of concentrated poverty (based on a 30 percent poverty rate threshold). The new filter ends up being more narrowly targeted to economically distressed, segregated areas, and thus captures fewer neighborhoods overall—roughly 13 percent of the state’s census tracts rather than the original 32 percent. As Richard Rothstein’s new book The Color of Law points out, these neighborhoods did not happen by accident: they are the product of a legacy of racialized housing policies that segregated whites from blacks, rich from poor. The new TCAC policies offer an opportunity to begin to redress that legacy.
While these are critical improvements, it is also important to acknowledge that the real world is more complicated than what can be captured in the point-in-time snapshots on these maps. It will be important for future iterations of the maps to tell a more dynamic story about access to opportunity at the neighborhood level by incorporating trends over time (including, for example, job or population growth) to account for places that are experiencing rapid change. Spatial shifts in opportunity – for example, as a result of gentrification or the decline of once affluent suburbs – can happen quickly, and policy decisions such as tax credit allocations should be positioned to keep pace.
Going forward, the Task Force also plans to consider ways in which the factors that promote or constrain the well-being of low-income households might differ in rural communities, and whether potential differences call for alternative metrics.
But even with these latest policy changes and proposed future refinements to the maps, TCAC’s process for allocating tax credits through the Qualified Allocation Plan (QAP) will not achieve the desired results without attention to the larger set of land use and housing policies at the city level that constrain where developers can find suitable sites and/or obtain affordable housing entitlements. The current maps reveal, for example, that of the 1,568 census tracts designated as “Highest Resource” more than 80 percent are comprised predominantly of single family homes, and in more than half (56 percent) of Highest Resource tracts, multifamily buildings with 10 or more units make up less than 10 percent of the housing stock. Without more proactive polices that ensure cities are adequately identifying land and zoning for multifamily housing, and without reforms to the ways in which more affluent communities allow for housing overall, the Opportunity Maps and revised QAP are unlikely to address the historical shortfall in LIHTC projects in prosperous areas on their own.
As TCAC rolls out the new regulations in the coming months, it will be important to closely monitor the effect of these new policy shifts on where and how much affordable housing is being built, as well as the longer-term impact of LIHTC housing on residents’ lives. In early 2018 the Terner Center will offer a contribution to this topic with a study that examines questions of economic mobility from the perspective of residents living in LIHTC-financed properties, revealing the nuanced relationship between affordable housing, neighborhood quality, and opportunity.
While much more work needs to be done on both the community development and fair housing fronts to expand access to better schools and higher paying jobs for low-income residents and communities, the policies TCAC enacted this week were an important step toward realizing those goals.
(1) According to a 2014 blog post from Novogradac and Company, “To qualify as a “large family” development, at least 30 percent of LIHTC units in the property must have three or more bedrooms; four bedroom and larger units must have at least two bathrooms; bedrooms must be large enough to accommodate two persons each; and living areas must be adequately sized to accommodate families based on two persons per bedroom.”
Share This Post:
Related Articles
Student Capstone Projects
As part of our commitment to the education and professional development of UC Berkeley students, the Terner Center highlights exceptional…

Lessons from California’s Statewide Efforts to Affirmatively Further Fair Housing
To counter the impacts of decades of discriminatory housing policies and worsening racial segregation, the State of California established a number of Affirmatively Furthering Fair Housing (AFFH) strategies. Designed to foster racially and economically inclusive, opportunity-rich communities, these efforts were intended to facilitate effective local fair housing planning and enacting statewide policies to promote integrated communities. A new Terner Center policy brief highlights key AFFH strategies, noting areas of progress and where additional efforts are needed. It examines California’s successes and challenges since 2016, offering recommendations for other states working toward fair housing goals.

Addressing the Housing Needs of Low-Income Households in the Bay Area: The Importance of Public Funding
This policy brief explores how public funding can address the San Francisco Bay Area's housing affordability crisis by increasing the…

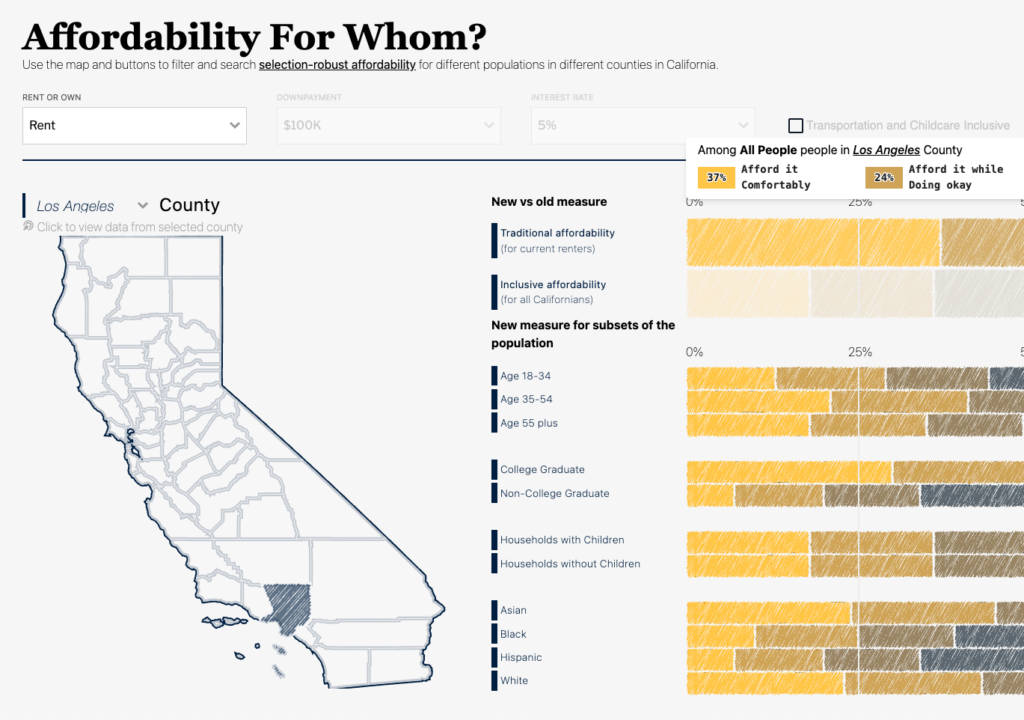
Affordability for Whom? Introducing an Inclusive Affordability Measure
This paper presents a new approach to measuring housing affordability—one that seeks to provide a better indicator of what counties…