Who Is Actually Forming New Households?
Published On August 17, 2015
For several quarters, the Census has reported an increase in household formation. This is the turnaround that the housing market has been waiting years for. During the recession, the number of households grew slowly, as young adults increasingly stayed in their parents’ homes and others doubled up, too, with siblings, adult children, or roommates. Now, the job market has improved, and household formation is on the rise, approaching or exceeding historical averages. As new households form, they fill up vacant homes, pushing up prices and rents. In response, homebuilders build more, which in turn adds to overall economic activity.
But there’s a puzzle. Surprisingly, even with an improving job market, the share of young adults living in their parents’ homes continues to rise, as the Census Bureau and the Pew Research Center have reported. The expected driver of household formation – young adults moving out of their parents’ basements – isn’t happening. So who is forming households?
The headship rate and the components of household formation
To understand this puzzle, we have to think about the headship rate, which equals the number of households divided by the adult population. A higher headship rate means fewer adults per households – or, equivalently, more households for a given population. For instance: if every household had two adults, the headship rate would be 50%. The headship rate can also be calculated for a demographic group: for instance, if all 30-year-olds lived with 3 other roommates, there would be one household for every four 30-year-olds, for a headship rate of 25%. Note that households can be either owners or renters; the headship rate doesn’t tell us anything about homeownership, but changes in the headship rate can make the homeownership rate misleading.
Headship rate in hand, we can break down household formation into three components:
- Adult population growth: All else equal, a growing population means more households. If the headship rate doesn’t change, then the adult population and the number of households grow proportionately.
- Shifts in the age distribution: older adults have a higher headship rate than younger adults. Young adults often have roommates or live with their parents rather than heading their own households. Therefore, household formation would increase as the population ages, even with no change in the overall adult population.
- Changes in the headship rate: the headship rate can change due to changing norms or behaviors, such as young adults marrying later and spending more years with parents or roommates, which would lower the headship rate. Short-term economic fluctuations also can swing the headship rate: in tough times, for instance, many people double up with relatives or roommates if they can’t afford to rent or own themselves.
Recent research from the Joint Center for Housing Studies and the Kansas City Fed apply a similar decomposition to household formation.
To estimate how much each component has contributed to household formation, we need recent microdata on living arrangements within households. The most current estimate of household formation is the quarterly Census Homeownership and Vacancy Survey (HVS); however, it only reports aggregate data (and has other flaws; see methodology notes). The main source for microdata on living arrangements is the Current Population Survey’s (CPS) Annual Social and Economic Supplement (ASEC), but the latest is March 2014.
Instead, we use CPS basic monthly microdata, which are best known as the source for the monthly unemployment rate but are also the basis for both the annual ASEC and the HVS; they’re available through June 2015. Combining headship rates from CPS basic monthly microdata with Census monthly national population estimates, we can estimate the components of recent household formation.
What’s driving household formation?
Let’s start with the first component: adult population growth. From the first half of 2014 to the first half of 2015, the adult civilian non-institutionalized population (age 16+) increased by 2.4 million, according to Census population estimates. The headship rate for the first half of 2014 was 50.2%. Household formation due to population growth alone, ignoring changes in headship rates or age distribution, equals the change in the adult population multiplied by the headship rate – which equals 1,193 thousand.
The second component is the changing age distribution of the adult population. The table below shows population estimates for the first halves of 2014 and 2015 (columns 1 and 2) and the percentage change (column 3). The oldest age groups are the fastest growing, thanks most of all to more baby boomers entering the 65-74 year-old bracket. The table also shows that headship rates rise with age (column 4 and column 5), as people leave their parents’ homes or roommate situations in young adulthood, live with no other adults or with a spouse, and then increasingly live alone as widowhood increases in the oldest age groups. The effect of the age distribution on household formation can be estimated by adding up the population growth of each age group multiplied by that age group’s headship rate (column 2 minus column 1, times column 4, added up and compared to baseline). The aging of the population between 2014 and 2015 contributed another 300 thousand households on top of the 1.2 million baseline. Again, this ignores any changes in headship rates for individual age groups.
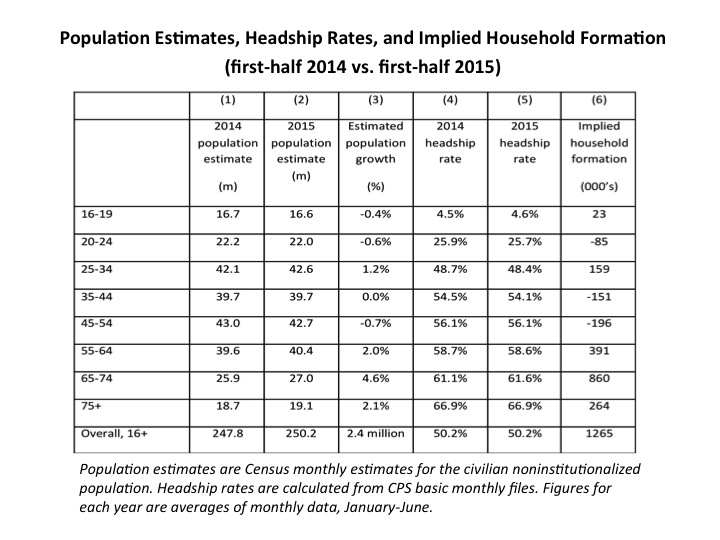
Finally, let’s add in the effect of changing headship rates. Surprisingly – and more on this below – the headship rate fell or remained flat for all age groups 20-64 (column 5 versus column 4). The only notable increase in headship rate was for 65-74 year-olds. Combining these changes in headship rates by age group with the 2015 population estimate for each group means that changing headship rates actually lowered household formation by roughly 230 thousand households – offsetting most of the boost from the aging population (column 5 minus column 4, times column 2, added up).
Therefore, household formation is being driven by overall population growth and the aging of the population, but not a broad increase in headship rates. The recent gain in household formation appears to be due to basic demographic shifts rather than the economic cycle.
A closer look at two key age groups
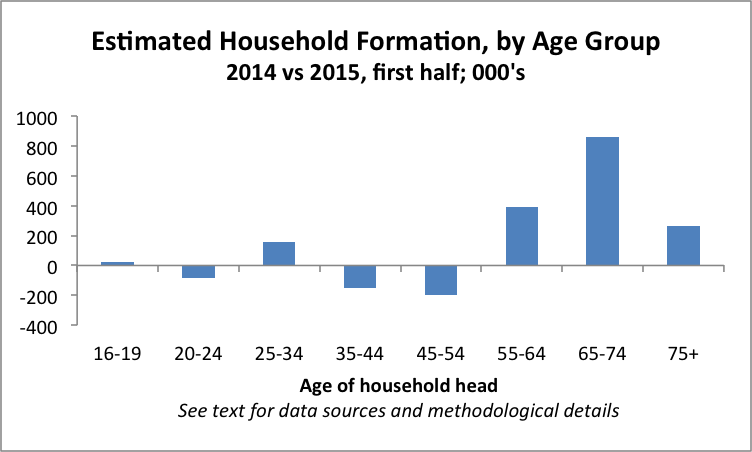 Despite expectations that millennials are the force behind household formation, older adults are driving household formation. Strikingly, age groups younger than 55 collectively had negative household formation between 2014 and 2015, while 65-74 year-olds accounted for more than two thirds (860 thousand) of overall household formation (column 6).
What explains why household formation is rising among older adults? The overwhelming reason is that U.S. population is aging, and the fastest-growing age group is 65-74 year-olds, both in percentage and absolute terms. In addition, older adults live in smaller households than younger adults, so population growth among older adults adds more households than population growth among younger adults. The rising headship rate among 65-74 year-olds is a relatively minor factor, accounting for roughly one-sixth of that age group’s overall household formation. A possible reason for rising headship among 65-74 year-olds is that the share who are divorced increased in 2015. However, it’s unclear without richer data and further analysis whether that is just a continuation of the longer-term increase in the share of this age group that’s divorced (while the widowed share has fallen) or, possibly, a bounceback after the decline in divorce rates during the recession.
What about young adults – why is their household formation meager? The share of young adults living with their parents increased in 2015, which lowers the headship rate. One contributing factor is that 25-34 year-olds are decreasingly likely to be married or cohabitating with a partner, and – unsurprisingly – married or cohabitating young adults rarely live with their parents (just 2% do) compared with 31% of those who aren’t living with a spouse or partner. The decline in marriage among young adults is a long-term trend, pre-dating the recession.
The link between having a job and living with parents is more complicated. Employed 25-34 year-olds are less likely to live with their parents (13% do) than those who are unemployed or not in the labor force (19%). Although employment-population ratio for young adults has risen steadily since 2011, young adults with jobs are increasingly likely to live with their parents. It’s unclear from the data why employed millennials are staying at home – are the jobs not good enough, or is housing too scarce or expensive? – but it’s clear that the employment recovery hasn’t gotten young adults out of their parents’ basements yet.
In short: the modest increase in household formation among 25-34 year-olds is due entirely to the growing population of young adults rather than changes in their living arrangements.
What it means for the housing market
Household formation boosts housing demand and therefore construction, regardless of whether that household formation is due to rising population growth or rising headship rates. But we’re not seeing a recovery in the type of household formation that is most directly affected by the economic cycle – within-age-group headship rates –despite the notable improvement in the job market in recent years.
Whether the fact that the bulk of household formation is coming from older adults is good or bad news depends on which side of the bed you got up on. The glass-half-full view is that a big jump in household formation from young adults moving out of their parents’ homes is still to come. When this pent-up demand is finally unleashed, it will be in addition to the increase in household formation from the aging population, fueling construction and overall economic growth. Optimists will be happy to hear that the drop in headship rates for 25-34 year-olds in the first half of 2015 was concentrated in the first quarter, with some improvement coming more recently in the second quarter that could point to the start of a turnaround. But the glass-half-empty view is that the drop in headship rates among young adults is not a lingering yet ultimately temporary effect of recession but, rather, a new, lower normal, thanks to rising housing costs, later marriages, and not-good-enough jobs.
The source of household formation might also have implications for future demand for housing. The age group forming the most new households – 65-74 year-olds – are the least likely age group to live in multi-unit buildings (versus single-family homes) or in urban neighborhoods. Of course, not every single 70-something wants a big house in the suburbs. Still, if boomers rather than millennials continue to drive household formation, future housing construction might turn out to be more suburban and single-family than many expect.
While we can’t know for sure whether current trends in household formation will continue and what they will mean for the housing market, it is clear that the engine of today’s household formation is not young people moving out of their parents’ homes and forming new households. Whether this means that much of the housing recovery it still to come, or that the housing market needs to adjust to a permanent downshift in the number of younger households, is a critical question for future analysis.
Methodology notes
Estimates of household counts and household formation produced from the different Current Population Survey (CPS)-based sources – basic monthlies, the Annual Social and Economic Supplement (ASEC), and the Homeownership and Vacancy Survey (HVS) – often disagree with each other and with the larger-scale, more infrequent American Community Survey and decennial Census. See here and here for more on the problem and efforts to solve it. In this blogpost we make no attempt to reconcile estimates of household formation or headship rates from different sources. Instead we focus only on single-source short-term changes to derive estimates, and focus more on trends than levels.
This analysis of headship rates and living arrangements uses the average of CPS basic monthly estimates from January to June for 2013, 2014, and 2015. Averaging over several months smooths small-sample monthly volatility, and comparing the same period across years mitigates seasonality concerns. Historical trends to 2014 are from the CPS ASEC; for 2014, only the 5/8 sample was available. For all samples, headship rates are calculated using an adjustment that counts each spouse in a married couple equally as co-heads of household, to correct for a gender bias in head-of-household assignment that ends up understating headship rates for younger adults and overstating headship rates for older adults. The handful of group-quarters residents in the basic monthly and ASEC samples were retained in the analysis for consistency with overall population counts, but were recoded to be non-head-of-household regardless of how their relationship-to-reference-person was reported. For all of these reasons, estimates in this blogpost may differ from published Census tables based on the same data sources.
CPS basic monthly files were downloaded from the National Bureau of Economic Research website. ASEC files were downloaded from IPUMS, which requests to be cited as: Sarah Flood, Miriam King, Steven Ruggles, and J. Robert Warren. Integrated Public Use Microdata Series, Current Population Survey: Version 4.0. [Machine-readable database]. Minneapolis: University of Minnesota, 2015.
Share This Post:
Related Articles
Student Capstone Projects
As part of our commitment to the education and professional development of UC Berkeley students, the Terner Center highlights exceptional…

Lessons from California’s Statewide Efforts to Affirmatively Further Fair Housing
To counter the impacts of decades of discriminatory housing policies and worsening racial segregation, the State of California established a number of Affirmatively Furthering Fair Housing (AFFH) strategies. Designed to foster racially and economically inclusive, opportunity-rich communities, these efforts were intended to facilitate effective local fair housing planning and enacting statewide policies to promote integrated communities. A new Terner Center policy brief highlights key AFFH strategies, noting areas of progress and where additional efforts are needed. It examines California’s successes and challenges since 2016, offering recommendations for other states working toward fair housing goals.

Addressing the Housing Needs of Low-Income Households in the Bay Area: The Importance of Public Funding
This policy brief explores how public funding can address the San Francisco Bay Area's housing affordability crisis by increasing the…

Affordability for Whom? Introducing an Inclusive Affordability Measure
This paper presents a new approach to measuring housing affordability—one that seeks to provide a better indicator of what counties…