Housing Highlights from the 2015 American Community Survey
Published On September 14, 2016
The Census Bureau has just released the 2015 American Community Survey (ACS), the most detailed and comprehensive regular source of housing data for the U.S. and local areas. The housing market continues to ease back toward normal, with a drop in vacancies, an increase in single-family owner-occupied units, and a decline in cost burdens. However, homeownership fell yet again, household formation remains below normal, and more young adults are living with parents (2016 Current Population Survey data).
Here are the housing highlights from the 2015 ACS, with more detail available in this slide deck:
Homeownership and household formation (slides 3-10):
- The homeownership rate slipped from 63.1% in 2014 to 63.0% in 2015, down from a peak of 67.3% in 2006 (slide 4). Among large metros, the 2015 homeownership rate ranged from 69% in Pittsburgh to just 48% in Los Angeles (slide 5).
- Multi-unit rentals were the fastest-growing housing type in 2015 (slide 7). In 2015, the number of single-family rental units fell year-over-year, even though single-family rentals increased by 34% cumulatively since 2006 (slides 6 and 7). The rental share of single-family detached homes dropped from 17.0% in 2014 to 16.8% in 2015, after climbing throughout the recession and recovery (slide 8).
- Household formation was 949,000 in 2015 – a slight dip from 2014 and still below the “normal” level of 1.2 million (slide 10). This was below the 2015 estimate from the Homeownership and Vacancy Survey (slide 23).
Housing costs (slides 11-14):
- The share of households spending 30% or more of their income on housing (“cost-burdened” households) fell to a post-bubble low of 33.6% in 2015, the fifth straight year that measure dropped (slide 12). Rising incomes and falling mortgage rates in 2015 helped reduce housing cost burdens.
- Nationally, 49.1% of renters in 2015 were cost-burdened, the lowest level since 2008. Among homeowners with a mortgage, 29.9% were cost-burdened, dramatically down from the recent peak of 38.3% in 2010 (slide 14).
Vacant homes (slides 15-20):
- The vacancy rate in 2015 fell a bit to 8.2% (excluding seasonal vacancies), slightly below its 2006 level (slide 16).
- The share of active-inventory vacant homes fell for the sixth straight year to 4.1%. Yet the share of inactive vacant homes – including seasonal vacancies – remained elevated at 8.2% (slide 18).
- The vacancy rate for single-family homes remained at 10.7% in 2015, near its peak of 11.0% in 2011 and well above its 2006 level (slide 19). In multi-unit buildings, however, the vacancy rate dropped for a fifth straight year to 14.4% in 2015 from a peak of 17.2% in 2010 (slides 20).
The full set of slides is available here.
A spreadsheet with selected data for the largest metros is available here.
Share This Post:
Related Articles
Student Capstone Projects
As part of our commitment to the education and professional development of UC Berkeley students, the Terner Center highlights exceptional…

Lessons from California’s Statewide Efforts to Affirmatively Further Fair Housing
To counter the impacts of decades of discriminatory housing policies and worsening racial segregation, the State of California established a number of Affirmatively Furthering Fair Housing (AFFH) strategies. Designed to foster racially and economically inclusive, opportunity-rich communities, these efforts were intended to facilitate effective local fair housing planning and enacting statewide policies to promote integrated communities. A new Terner Center policy brief highlights key AFFH strategies, noting areas of progress and where additional efforts are needed. It examines California’s successes and challenges since 2016, offering recommendations for other states working toward fair housing goals.

Addressing the Housing Needs of Low-Income Households in the Bay Area: The Importance of Public Funding
This policy brief explores how public funding can address the San Francisco Bay Area's housing affordability crisis by increasing the…

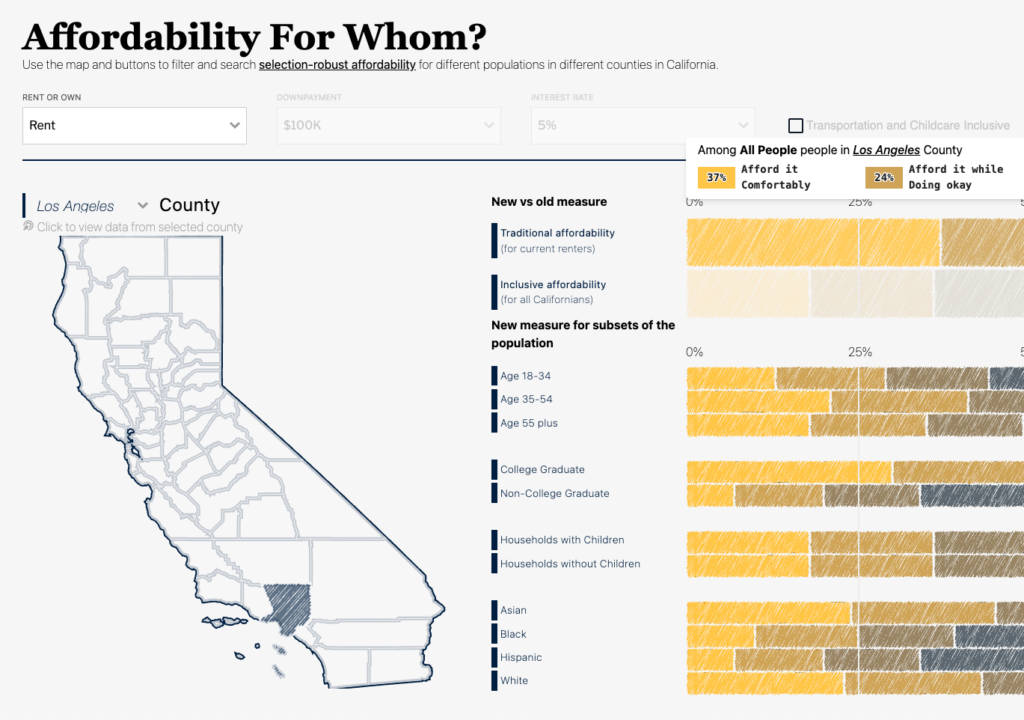
Affordability for Whom? Introducing an Inclusive Affordability Measure
This paper presents a new approach to measuring housing affordability—one that seeks to provide a better indicator of what counties…